Artifact Catalog
Codes
Site names
Notes
Item record
Documentation
Excavation Methods
At the commencement of the 1985 field season, horizontal metric grid control was established and the site was initially mapped with the aid of a Lietz telescopic level and stadia rod. A datum was established about 20 m south of the landing strip near its eastern end, on the highest part of the paleobeach terrace. A grid system was staked out running out from this datum in four cardinal directions. This main site datum has an elevation of 2.36 m above sea level. All 1-m2 excavation units are designated by the intersection of their east–west and north–south grid numbers (e.g., a unit designated W250N150 would be situated 250 m W and 150 m N of the site datum). Elevation profiles were taken along key transects, correlated to sea level through the use of elevation readings with the aid of a tide chart. For this I used the NOAA tide chart (NOAA 1987), with our tidal information based on Truk Island (Dublon Harbor), applying the necessary temporal and height correction factors stipulated for Emirau (station 3089; NOAA 1987:331).
Excavation proceeded by “natural” stratigraphy, that is, by sedimentary units of deposition. However, when a natural stratum proved to be fairly thick (e.g., more than about 10 cm) it was usually subdivided into two or more levels. The level is thus the minimal unit of vertical control in our excavations. A single level may or may not correspond to a stratigraphic layer, depending upon whether the latter was subdivided into more than one level. However, levels never cross stratigraphic boundaries. The main excavation tool was the Marshalltown trowel, aided by whisk brooms and paintbrushes for fine work. Excavated sediment was transferred to buckets using plastic dustpans, and the bucket contents then sieved (see Recovery Techniques, below). Artifacts found in situ were three-dimensionally plotted; all other materials were provenienced by unit and level, with each lot or item numbered sequentially within each level. Thus the field code ECA/W250N150/6/42 would refer to the forty-second item recovered from level 6 of Unit W250N150 in site ECA. Vertical control was maintained either by recording the depth below surface, bs (from the southwest corner of the unit), or by measuring depth with telescopic level and stadia rod and converting this to depth below site datum. During and after excavation, a photographic record was made using both black-and-white and color 35-mm film. At least one stratigraphic profile of each unit was drawn at 1:10 scale. Layers were described according to a standard set of criteria, including grain size, lithology, color (Munsell system), structure, nature of stratigraphic boundaries, and so forth. Sediment samples were taken from selected stratigraphic profiles for laboratory analyses of grain size and other characteristics. Sediment sampling followed the procedures outlined by Stein (1985, 1987). Certain terms widely used in archaeological parlance nonetheless vary considerably in their definitions, and therefore we wish to be explicit regarding their meaning in this monograph:
Grid Unit (or simply unit): the horizontal unit of control, a 1 x 1 m block. Units may be further specified as test units or transect units.
Level: the vertical unit of control within a unit. Levels never cross natural stratigraphic boundaries, although they may be of artificially defined thickness within natural strata, when it was necessary to subdivide a thick deposit for purposes of vertical control. Levels are numbered with Arabic numerals from top to bottom. (Because our 1985 excavations were undertaken as a part of the Australian-organized Lapita Homeland Project, we fell into the habit of referring to levels as “spits,” using the Old World term common among Australian archaeologists. Our field forms likewise use the term “spit.” In this monograph, however, we exclusively use the American term “level.”)
Layer: a natural sedimentary and depositional stratum, defined in terms of lithology, structure, grain size, color, boundary contacts, and similar criteria. One layer may correspond to one or more levels. Layers are numbered with Roman numerals from top to bottom; facies distinctions within layers are sometimes designated with letters (e.g., Layer IA).
Analytic Zone (or simply zone): an aggregate of levels across two or more units, combined for purposes of analysis and reporting of cultural content. Levels combined into an analytic zone are regarded as being chronologically and stratigraphically equivalent. Analytic zones are
designated with capital letters, from top to bottom; subzones are numbered with numeric subscripts.
Excavation Objectives and Strategy
As the work at Talepakemalai proceeded over three field seasons, our research objectives evolved considerably, requiring changes in excavation strategy and procedures. In 1985, we had no idea that the site would prove to be so extensive, or that we would encounter a waterlogged component with abundant organic materials necessitating special excavation and recovery techniques. During the 1986 and 1988 seasons efforts were made to address these conditions, and new research questions were also outlined (see Chapter 1). The following paragraphs provide an overview of the changing research objectives and excavation strategies applied during the three seasons of fieldwork at Talepakemalai.
The 1985 Season
Arriving on Eloaua in early August 1985, and after reconnoitering the ECA site with Ave Male as my guide, I decided that the highest priority was to define the site’s boundaries and to construct an accurate site map. For this purpose, a series of intersecting systematic transects with test units positioned at regular intervals appeared to be the most appropriate strategy. I had previously applied such a transect approach in defining large open midden sites in both Tikopia and Niuatoputapu (Kirch and Yen 1982; Kirch 1989). I expected the systematic transect units to yield a representative sample of ceramics and other cultural remains, thus meeting our objectives of defining the site’s cultural content.
After establishing the site datum and coordinate grid system, a primary east–west transect was laid out along the N0 line, with test excavation units positioned every 100 m parallel to the landing strip, beginning at E100N0 and extending to W500N0. (The first set of transect units excavated in 1985 was initially numbered TP-1 to 15, and are so referenced in field notes and earlier reports, rather than by their coordinate grid locations.) Excavation of these units quickly showed that the cultural deposits through this central part of the site were uniformly shallow, typically consisting of 15–25 cm of dark loam containing highly fragmented and worn potsherds along with some bone and shell midden. These deposits had been extensively reworked through intensive gardening; only in one unit (W100N0) did two pits or possible postmolds extend below the reworked garden soil into the basal calcareous sands. The N0 transect units also allowed us to define the east and west boundaries of the site, demonstrating that these coincided with low, swampy depressions marking former shorelines.
The second phase of transect testing commenced along three perpendicular north–south transect lines, at W100, W200, and W400. At the same time, systematic surface walking and recording the presence of sherds, shell midden, fire-cracked rock, and other cultural debris helped to define the areal extent of the site. Rather than several concentrations of midden as depicted in Egloff ’s map (1975:Map 4), we determined that cultural materials were distributed more or less continuously over an area of at least 72,500 m2 (the area within the dashed line labeled “limits of surface pottery” on Figure 3.2). It was also evident that this area of surface distribution of cultural materials corresponded to a former beach terrace, 0.8–1 m higher than those portions of the coastal flat bounding the site on the east, north, and west.
Our initial impression that the ECA cultural deposits might prove to be uniformly thin and heavily disturbed by gardening activities was contradicted when we opened Unit W200N100 (originally designated TP-13). Because this unit was positioned just 7 m east of the trench excavated in 1978 by Bafmatuk and others (1980), I fully expected our new excavation to reveal the same shallow, single-component stratigraphy reported by them. When we dug below the dark loamy garden soil, however, we were surprised to discover pottery, obsidian, bone, and shell midden extending well into the white, calcareous beach sands down to 100 cm, at which depth the deposit became strongly cemented, prohibiting further excavation with trowels. The large sherds in the lower white sand layer of Unit W200N100 lacked the broken and worn sherd edges typical of those from the upper garden soil. These finds contradicted the simple stratigraphic interpretation of the site suggested by Egloff (1975), and by Bafmatuk and others (1980), at least for this portion of the site, making further testing essential.
Another transect unit was opened up 50 m farther north along the W200 line (W200N150, originally designated test unit 14), at a location beyond the putative former shoreline, where there were few if any cultural materials on the surface. Indeed, based on our surface survey and my initial interpretation of the site’s geomorphology, the W200N150 location was thought to lie beyond the site’s periphery, and was opened up merely to confirm this hypothesis. While the upper 65–70 cm of this unit yielded only minimal cultural material, at approximately 70 cm bs we encountered a concentrated deposit of large, unweathered sherds, nearly half of them carrying classic dentate-stamped Lapita decoration. At this depth the sandy deposit became waterlogged; it was clear that we were at the tidally fluctuating contact with the brackish-water Ghyben-Herzberg aquifer. Directly associated with the thick deposit of sherds were abundant large obsidian flakes, two whole Conus-shell rings, a small Conus-shell bead, and a perforated pig-tusk pendant. Our field notes for this day reveal the dual sense of exhilaration and confusion created by the emerging finds in the W200N150 pit. Testing what we thought would be the northern periphery of the site, we had unexpectedly encountered an extremely rich, undisturbed Lapita deposit, inundated by the island’s freshwater lens.
I decided at this juncture to temporarily halt the systematic transect excavation strategy, switching to two locations for expanded areal excavations. Area A consisted of a 2 x 3 m block defined by Units W228-229/N100-102, about 20 m west of the 1978 PNG National Museum excavation (and 28 m west of our TP-13). Situated on the higher beach terrace (ca. 1.90 m asl) just above what I interpreted as the former shoreline (represented by a north-dropping slope of ca. 0.8 m), Area A was chosen to reveal the stratigraphy of this elevated terrace, and to confirm whether cultural materials extended appreciably below the disturbed dark loamy garden soil (Figure 3.6). The lower white sands did indeed yield considerable plain pottery, dominated by large jars with restricted orifices and flaring rims. However, a mere three sherds had dentate-stamped designs.
A second 6 m2 areal block was laid out to incorporate the W200N150 (test unit 14) pit which had produced the striking Lapita finds in waterlogged deposits below 70 cm depth. This block—designated Area B—was defined by Units W200-201 and N149-151. (With the commencement of the Area B excavation, a permanent datum was established [at 1.91 m above sea level], and we began taking all depth measurements with the use of a surveyor’s level and stadia rod. This datum was maintained throughout all three excavation seasons.) Stripping off the dry upper deposits (the dark garden soil, followed by a gray sandy deposit) we found that cultural materials were infrequent, especially in the gray sandy deposit as one approached the water table between 60–70 cm below surface. Just as the deposit turned white and became increasingly damp and sodden, a thick concentration of Lapita sherds appeared along with obsidian, bone, and shell midden. Unequipped for a proper “wet site” excavation, we faced several technical problems. Lacking pumps to remove the brackish water that seeped continually into the pits, we always kept one unit lower than the others, and used buckets to bail out this sump. As we proceeded deeper, the Area B excavation would flood completely overnight, requiring an hour or more of bailing each morning. Knowing that the water table fluctuated tidally, I used a tide table to plan work around predictable periods of low tides with a corresponding lower water table in the excavation. Gradually, we were able to extend the Area B excavation well into the waterlogged deposit.
A second problem was that the thoroughly saturated sherds were soft and fragile when first exposed, although they became relatively hard after drying. Experiments with different drying conditions revealed that rapid sun-drying was detrimental, sometimes resulting in severe shrinkage, warping, and cracking. Therefore, as sherds were removed from the waterlogged sands, they had to be carefully laid out on trays (we used damaged sieving screens for this purpose) and kept in cool, shady conditions to dry out slowly over several days. The floor of our field house became an obstacle course of hundreds of sherds drying in the most protected situation we could afford them. The water saturation of the ECA sherds proved to be a continuing problem beyond the drying stage, as the salts left within the sherds began to migrate toward the surface, causing exfoliation and cracking. This necessitated intensive laboratory conservation, as described in Chapter 1.
We were now excavating in an undisturbed deposit, for not only were the sherds, artifacts, and faunal materials in an excellent state of preservation, but we encountered matching sherds making up large portions of vessels lying intact just as they had been discarded and broken. Taking advantage of several days of unusually low tides, we approached the base of the thick concentration of Lapita materials, exposing a deposit of coral reef rubble representing the precultural surface.
When we first broached the waterlogged deposit in the W200N150 (TP-14) test, the highly decomposed top of a vertical wooden shaft or post appeared. At first I thought this might be the base of a rotted tree root, but as more of this object was exposed as we proceeded into the waterlogged zone, the wood became increasingly well preserved. On August 28, taking advantage of a particularly low tide and hence low aquifer, we brought the Area B excavation to the bottom of this object and removed what proved to be the worked base of a wooden post that had been set upright into the coral reef rubble. Adze marks were visible on the tapered point of the post, which was 65 cm long. There was little doubt that this post was directly associated with the Lapita materials (as radiocarbon dating would subsequently confirm). The realization that we had a site with intact Lapita wooden architecture occasioned excitement among both the archaeologists and our team of Eloaua workers. (While the archaeologists were excited by the prospects of recovering—for the first time—perishable architecture of Lapita age, the Eloaua people saw the discovery of the preserved post as confirmation of an oral tradition that a special “haus matmat” [burial house] had formerly stood in the area known to them as Talepakemalai.) Several other smaller wooden stakes appeared in Units W200N151 and W201N151 as we cleared the deposits down to the coral rubble layer.
At this juncture—despite the exciting nature of the Area B finds—it was essential to temporarily halt the ECA site work, in order to test two other Lapita sites: ECB on Eloaua and EHB on Emananus Island. Neither of these sites proved to contain a waterlogged component as at ECA. After sufficient transect tests were completed at ECB and EHB, I decided to conclude the 1985 season by expanding the Area B excavation at ECA. We gridded out another 6 m2 area adjacent to the existing block, comprising Units W198-199/N149-151. This excavation clarified our understanding of the Area B stratigraphy, yielding additional well-preserved wooden posts forming the corner of a structure. Since we had determined that the Lapita materials had been deposited subtidally and had not been subsequently disturbed, I reasoned that the posts were the supports for a stilt- or pole-house that had been elevated above the reef flat at a time when the island’s shoreline was situated approximately 30–40 m south of Area B. After completing this 6 m2 expansion to Area B, the base of the excavation—with wooden posts left in situ—was protected by laying down a sheet of thick plastic, followed by backfilling.
The 1986 Season
On September 1, 1986 we recommenced the Talepakemalai site excavations. My first priority was to expand the Area B excavation by at least double to expose more of the stilthouse architecture and to increase the sample of associated cultural materials. I also wanted to refine our model of the site’s geomorphology and depositional history, in regard to former shorelines and to the progradation of the coastal flat that buried and preserved the Area B wooden architecture. A systematic transect approach was again appropriate, this time utilizing close-spaced transect units extending outward from the Area B block in order to fit Area B into a micro-stratigraphic and geomorphological context.
Having learned from the challenging experience of excavating the waterlogged Area B deposits without adequate equipment in 1985, we arrived on Eloaua in 1986 armed with tools to allow us to tackle the site’s unique conditions I had purchased in the United States two sizes of manually operated diaphragm-type pumps intended for use as bilge pumps on small boats. These not only allowed us to continually remove water from the pits, but the outflow could be used to wet-sieve the excavated sediment. Without wet-sieving, the water-saturated sand passed through 5 mm mesh only with great difficulty; the use of the water outflow from the pumps allowed us to screen materials through 3 mm mesh, and so to recover fine bone and floral materials without significant breakage. I had also prepared new field recording forms, and had brought along better surveying and photographic gear and—very importantly—an abundant supply of waterproof labels, plastic bags, and cotton wool for packing and protecting the fragile waterlogged pottery.
With Terry Hunt and Marshall Weisler as excavation supervisors, I engaged 13 to 15 Eloaua islanders to assist in the excavations. The backfilled 12 m2 Area B block from 1985 was reopened and the plastic sheeting that had protected the floor of the excavation was removed. A new block of six squares adjoining the 1985 excavation on the east side was gridded out (Figure 3.8), comprising Units W195-197N150-151. This was matched several days later by a south expansion (Figure 3.9), comprising Units W198-200N147-148. In total, we exposed 24 m2 at Area B, within which we defined two alignments of anaerobically preserved house posts meeting at a reinforced corner. Initially, I had hoped to trace these alignments to additional corners, and thus expose an entire stilt-house outline. This goal was thwarted by the sheer volume of cultural materials recovered, and by the massive amounts of time and labor necessary to wet sieve, recover, and process them. I decided that it was a higher priority to conscientiously recover all vertebrate and invertebrate faunal materials retained in the 5 and 3 mm mesh sieves, as well as 100% of the ceramic assemblage, than to merely sample the cultural materials in the interests of exposing more wooden architecture. An additional consideration was that as the excavation grew in area, the volume of water to be pumped increased proportionally. As the full 24 m2 reached the sub-water table level, the task of pumping out the excavation each morning (the pits would fill with water during the night) became more time-consuming, to a point where the entire 15-member team was engaged in pumping and bailing for as much as two to three hours before excavation could commence.
Simultaneously with the expanded Area B excavations, we laid out a series of transect test units along the W200 grid line, which had been tested by the W200N100 (TP-13) and W200N150 (TP-14) pits in 1985. Units were laid out at 10 m intervals along the W200 line, beginning at W200N110 and ending at W200N200. A second series of four units was laid out along a perpendicular axis following the N140 grid line, at 20 m intervals. These two transects were positioned to reveal a detailed picture of the stratigraphic context surrounding Area B over a distance of 100 m north–south and 80 m east–west. The north–south transect along the W200 line furthermore extended across a major geomorphological transition: a drop of 0.8 m in elevation (from 2.01 above sea level at W200N100 to 1.20 in the vicinity of Area B), which I interpreted as the approximate location of the former shoreline of Eloaua Island.
These transect excavations verified that the W200 transect indeed crossed a former shoreline feature, so that at the time of the mid-Holocene higher sea-level stand the Area B stilt house had stood on a reef flat over open water. Moreover, the W200 transect pits lying between Area B and Unit W200N100 exposed a deeply buried zone of fine, silty-textured calcareous sediment that contained a high quantity of anaerobically preserved organic materials, especially wood fragments, coconut husk and endocarp, and remarkably, a variety of seeds, nut shells, and other floral remains. We came to refer to this fine-textured deposit as the “muck zone.” As with the foreshore reef-flat environment fronting Eloaua Village today, there was in Lapita times a low-energy tidal flat lying between the stilt house and the former beach slope, which had trapped organic refuse discarded by the site’s inhabitants. Here was another unanticipated payoff of the waterlogged condition of this Lapita site, for the abundant plant remains consisted of a wide range of economic taxa (see Chapter 10). For the first time, a Lapita site had yielded an abundance of direct, macrofloral materials of ethnobotanical significance. We closed the 1986 excavations at ECA on September 25, although two more weeks of intensive work were required to complete the processing of shell midden and prepare all other materials for shipment to Seattle.
The 1988 Season
The third season at Talepakemalai began on September 22, 1988, with Dana Lepofsky and Jason Tyler assisting as site supervisors, and a crew of 10 to 15 Eloaua men and women. After recutting the now overgrown W200 transect line and relocating our Area B datum, we cleared a transect running north–south along the W250 line, 50 m west of our 1986 transect and parallel to it. This new W250 transect started on top of the former beach ridge and cut across the former shoreline feature, extending out over the buried reef flat. As with the 1986 transect, test units were laid out at 10 m intervals, commencing at N70 and running continuously to N200, a total of 14 units. (Later in the season, one additional transect unit, W225N150, lying halfway between the W200 and W250 transects, was excavated under the supervision of Nick Araho of the PNG National Museum.) I expected this transect to provide a second stratigraphic and geomorphological sequence to assist in the interpretation of the site’s depositional history, to reveal the extent of stilt-house structures west and north of Area B, to further sample the buried foreshore zone of anaerobically preserved plant remains (the “muck zone”), and to provide samples of shellfish remains for our shell technology and invertebrate exploitation studies. In all these respects, the W250 transect served admirably. As in 1986, hand-operated bilge pumps were used to keep the pits (often reaching depths of 1.8 m) from flooding, as well as to provide water for wet-screening.
A further innovation in 1988 was the use of volumetrically controlled samples for fine-screening and flotation, to test whether our samples were biased toward larger sized items. While all excavated sediment was routinely wet-screened through 5 mm mesh, we took 1 liter bulk samples of sediment from every level, processing these in our field laboratory by flotation with wet-sieving of the non-floating fraction through 0.125 inch mesh. Flotation involved pouring the bulk sample into a bucket which had the bottom removed and was covered with a fine mesh. The floating fraction was skimmed off and air-dried; this material was subsequently examined by Lepofsky for small plant remains. This time-consuming flotation yielded little in the way of plant remains, because most of the preserved seeds and nut cases were large enough to be captured by the 5 mm mesh screens. Nonetheless, the effort was worthwhile in eliminating any doubt concerning potential size bias in our paleoethnobotanical collections. The non-floating residue was wet-sieved through 0.125 inch mesh and air-dried. The small vertebrate remains recovered from fine-sieving were subsequently examined by Virginia Butler to check for size and recovery bias in her analysis of the ECA fish remains.
As the W250 transect excavations proceeded, I realized that stilt or pole structures had formerly been erected over the reef flat throughout the zone sampled by the transect, evidenced by one or more preserved wooden posts or stakes in upright position in many of the test units to the north of the former shoreline (situated at about N105). Thus the stilt structure exposed in Area B was just one of a complex of pole-supported structures that extended over a zone some 100 m from the original shoreline.
As our transect excavations progressed from south to north, I could also see that the pottery assemblages exhibited changes in the frequency of particular vessel forms as well as in decorative techniques and motifs. Having completed a preliminary analysis of the Area B ceramic assemblages from the 1985–1986 seasons, I knew that these differences along the W250 transect reflected chronological changes in the Lapita pottery complex. As we approached the north end of the W250 transect, dentate stamped pottery was largely replaced by incised pottery. In short, there was an age progression along the W250 transect. Evidently, the shoreline had rapidly prograded while the Talepakemalai site was being occupied, so that as the shoreline migrated northward, the zone of pole houses gradually shifted to the north as well.
When Unit W250N190 came down upon two especially large wooden posts—associated exclusively with incised pottery (which I knew to be dominant at the terminal end of the Mussau Lapita ceramic sequence)—I decided to expand the excavations in this vicinity. Because the sandy deposits here were completely unconsolidated and susceptible to collapse (especially as one penetrated below the water table), we were not able to open up an extensive area. However, two blocks of 4 m2 each, offset 1 m north–south and east–west, were gridded out and designated Area C. These exposed an array of 20 posts and stakes, along with an assemblage of incised pottery, obsidian, and other cultural materials, providing an excellent sample of the late end of the occupation sequence at Talepakemalai.
We also expanded excavations at the Area B locality, with a new 4 m2 block defined by Units W200-201N144-145, separated by a 1 m baulk from the south edge of the 1986 Area B excavation. Our aim here was primarily to obtain a closely controlled sample of molluskan midden for analysis by our marine biologist colleague Carla Catterall (see Chapter 9). However, this also permitted us to obtain an additional sample of ceramics and other materials which, because we were able to impose particularly good stratigraphic control (having previous knowledge of the stratigraphic sequence from previous seasons), we were subsequently able to use for detailed temporal analysis of the ceramic sequence in Area B. This block is referred to as the Area B Extension.
Finally, we carried out a series of corings using a 10 cm diameter bucket auger west along the N140 grid line 50 m to W300, in order to track the subsurface extent of the organic zone containing preserved plant remains. These cores, combined with the transect operations, revealed that the waterlogged part of the Talepakemalai site extends over an area of at least 10,000 m2 lying north of the old shoreline. All of this area is also north of the zone of surface sherd distribution, with the combined total area for cultural deposits at ECA something in excess of 82,000 m2. This makes ECA the largest Lapita site yet recorded in either Near or Remote Oceania. While I am reasonably confident that the W250 transect reached the northern extent of subsurface cultural deposits in the vicinity of Unit W250N200, the full extent of these waterlogged deposits to the east and west remains undetermined. Excavation of additional transects would have been required to achieve this objective, beyond the resources of our 1988 expedition. Suffice it to say that more work remains for a future generation of archaeologists at Talepakemalai.
The 1988 season at ECA ended on October 12, when all units were backfilled. Over three field seasons, we excavated a total of 84 m2 at the site, reflecting a volume of about 95 m3 of sediment, 100% of which was sieved (Table 3.1). Given a total site area in excess of 82,000 m2, our excavations represent a mere 0.1% sample of this immense site. Yet the acquisition of that sample was no small feat, requiring the expenditure of 849 person-days of fieldwork, accompanied by an even greater amount of labor in laboratory processing, cataloging, and analysis, all supported by a small fortune in grant funds. While a 0.1% sample is two orders of magnitude smaller than the “mystical” 10% figure often cited as minimal by devotees of random sampling, the quantity of cultural materials produced is daunting: 44,089 ceramic sherds, 94,749 vertebrate faunal remains, 7,905 plant remains, 1.43 metric tons of mollusk shells (all of which were weighed and processed), and hundreds of other artifacts and manuports. In retrospect, I regret that we were unable to expose at least one complete stilt-house structure. However, when I remind myself of the effort expended simply to achieve what we did, I am brought back to the reality that an excavation of sufficient magnitude to expose a full structure—minimally 150 contiguous m2 or more—would have consumed financial resources, time, labor, and equipment far beyond those available.
Recovery Techniques and Sampling Biases
As the Mussau Project progressed, we became increasingly engaged with issues of recovery and sample bias, especially after Butler (1988) and Nagaoka (1988) undertook systematic reviews of the Lapita faunal evidence (and of the different screening methods used to recover these) prior to the 1988 expedition. In 1985, we had little choice in recovery methodology, because the screening equipment was provided in advance by the organizers of the LHP, consisting of several sieves of 7 mm and 5 mm mesh, and a single sieve of 3 mm mesh. (The single 3 mm sieve, in poor condition, broke before the end of the field season.) We used the 5 mm mesh as much as possible, taking control samples with the 3 mm mesh to determine whether there was significant size bias in the assemblages retained by the 5 mm sieves. These tests indicated that the 5 mm mesh sieves were retaining most of the small faunal remains, as well as all potsherds and obsidian flakes. In 1986 we therefore equipped ourselves with a number of new 5 mm mesh sieves, as well as additional 3 mm sieves. (In North America, mesh sizes of 1/4” and 1/8” are routinely used, with most zooarchaeologists insisting that the 1/8” mesh is essential to avoid bias toward larger elements in faunal assemblages. The 5 mm sieves we used in Mussau are approximately 3/16”, while the 3 mm sieves are slightly finer than 1/8”.) In 1986, we also initiated the regular use of wet-sieving at the ECA site.
We remained concerned about possible bias in the dominant use of 5 mm mesh in our excavations, and at the urging of Virginia Butler conducted additional comparative sieve tests in 1988. Butler’s analysis of faunal suites recovered through the 5 and 3 mm meshes revealed no statistically significant differences between the fish remains recovered; I am thus satisfied that our screening methodology did not introduce significant bias into our assemblages. For persons working with the Mussau Project collections in the future, a database has been compiled indicating mesh size, and use of wet or dry sieving, for all units and levels of all sites. Thus sampling decisions regarding the Mussau collections can be made explicitly on the basis of recovery technique.
During the 1988 season, we devoted substantial effort to the systematic subsampling of every unit and level excavated at the ECA site with 1 liter bulk sediment samples, which were both floated and fine-sieved through 0.125 inch mesh to recover minute floral and faunal materials. This labor-intensive work yielded only marginal improvements in recovery rates, but again reassured us that our main sieving techniques were not biased.
Recovery is affected not only by excavation and screening methods, but by what is retained for analysis and further study. I determined early on that we would save for analysis 100% of all cultural materials retained in whatever sieve size was being utilized, for every excavated unit. This procedure reflects the view that excavation itself is already an act of sampling a universe (the site) of unknown—but almost certainly not random—distribution, and that a priori subsampling for faunal remains or other particular classes of material would only lessen our ability to understand site structure. We thus concur with Leach and Leach (1979) in their stated justification for collecting “massive residues” from excavations at Palliser Bay, New Zealand: “this approach was adopted in the belief that the analysis of cultural samples will only reveal information about the samples and not the population from which they derive. Cultural evidence is not distributed randomly; therefore, random sampling will not reveal cultural distributions” (1979:5). The wisdom of saving all cultural materials retained by the sieving operations was questioned by team members more than once as—already exhausted by a long day of digging in the tropical heat and humidity—we worked long into the night sorting, weighing, and counting staggering quantities of shell midden. Indeed, the processing of invertebrate midden materials consumed a large amount of time and labor; at the ECA site alone, we processed 1.43 metric tons of shell midden during the three seasons.
Although 100% of all excavated and sieved cultural materials were returned to the field laboratory, budget restrictions dictated that only some materials could be shipped to the United States for study and eventual curation. Thus, sampling decisions again had to be made to analyze under field conditions certain classes of cultural materials which would then be discarded. The following classes of materials were retained for permanent curation: (1) non-ceramic artifacts; (2) diagnostic sherds (include rims, carinations, bases, and any sherd bearing decoration), as well as large representative samples of plain body sherds; (3) vertebrate faunal remains; and (4) paleobotanical remains except for unmodified wood and coconut endocarp, which were sampled. Minimally, shell midden from each level was bulk weighed prior to discarding. For a large number of units, shell midden was first sorted to taxonomic class, each class being weighed individually. During the 1988 field season, this procedure was extended by also counting shell MNI for individual taxa, and by taking extensive series of individual shell measurements (see Chapters 8 and 9 in the book).
Recording Systems and Databases
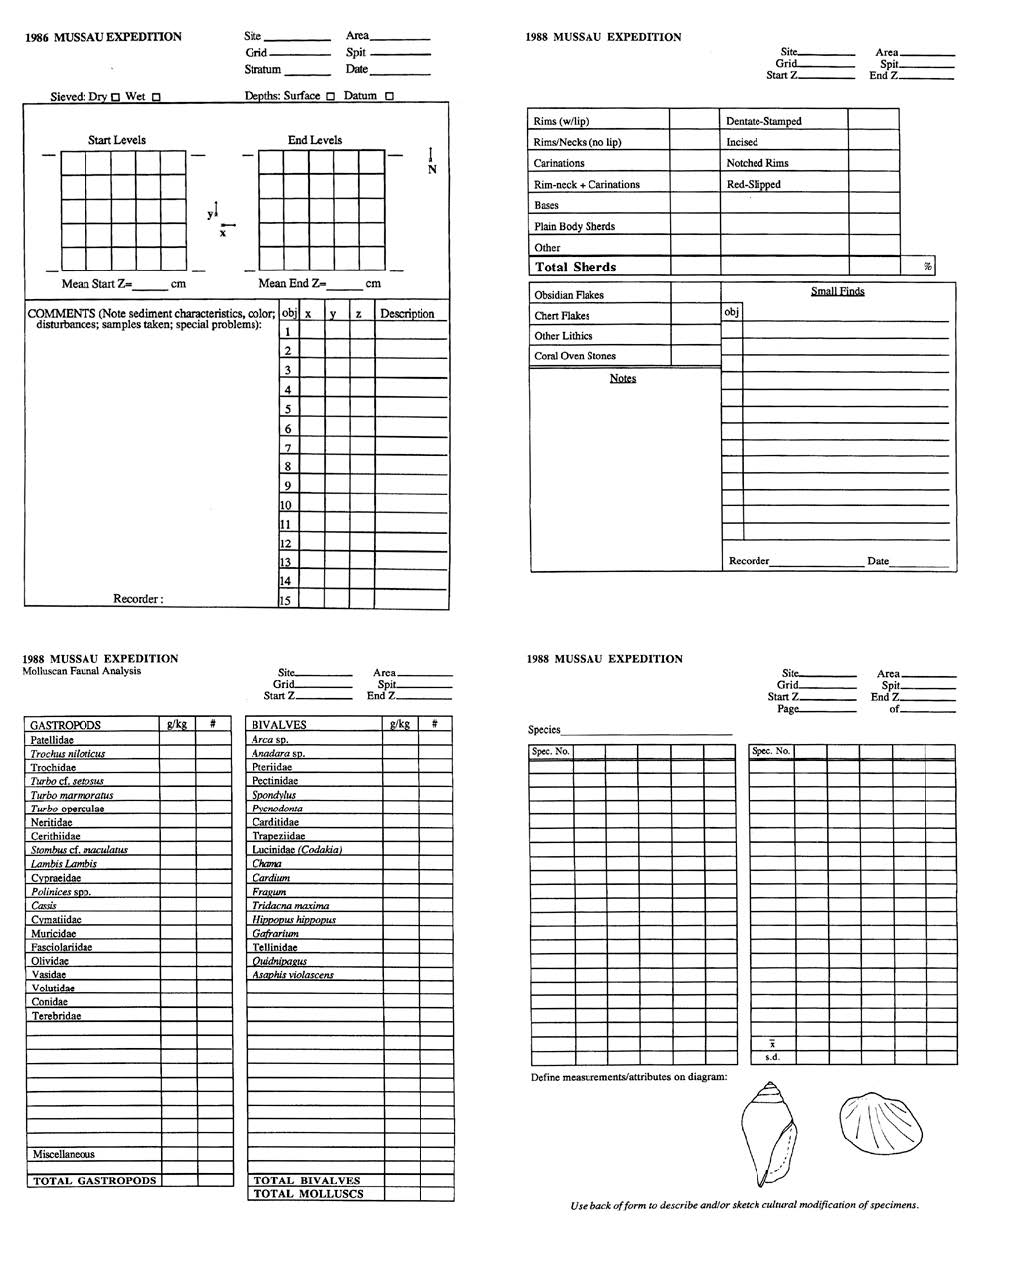
The field and laboratory recording systems and databases used by archaeologists in the complex process of converting an in situ depositional context of cultural materials—a site—to a curated “archaeological record” are not trivial matters, for such systems of recording, indexing, and retrieving data impose a certain structure by their very existence. The importance of standardized recording procedures was recognized by the organizers of the 1985 Lapita Homeland Project, who provided all field teams with preprinted excavation recording forms, in self-carbon duplicate sets. The intent was that each field team would retain the top copy, submitting the duplicate to the Australian National University, where data would be coded and entered into a Lapita Homeland Project-wide database using the MINARK software program. Regrettably, this well-planned scheme did not materialize, as some team directors failed to use the preprinted forms, and because funds were not available for data coding and computer entry after the conclusion of fieldwork.
For the 1986 and 1988 expeditions, I modified the field recording forms, with improvements based on our 1985 experience. This “level form,” an example of which is shown in Figure 3.5, provides the primary record for each excavated level. The sheet records provenience data, sieve size and wet/dry recovery data, whether depth was recorded below datum or below surface, start and end depths for the level, diagrams of all features at the start and end of excavation, descriptions of sediment, recovered finds, etc., and a list of all objects provenienced by x, y, and z (depth) coordinates. In addition, I maintained a daily log, and recorded stratigraphic profiles of excavated units in standardized bound field notebooks. Three additional preprinted forms were used to assist in processing and recording of excavated materials in the field laboratory: (1) The first was a “small finds form” on which the washed and sorted pottery sherds from each level were enumerated according to sherd type (rims, body sherds, etc.) and decorative technique. Also recorded on the small finds sheet were data on coral oven stones, and on worked shell debris (chipped Trochus and Conus shell detritus from the manufacture of shell artifacts) determined during the processing of shell midden. (2) The second form recorded weight and NISP/MNI counts of mollusks. (3) The third form (used in 1988 only) recorded standard measurements on individual midden shells. Examples of these field laboratory forms are illustrated below.
Upon our return from the field, finds were unpacked and checked against the level and small finds forms, catalog numbers written on all objects with indelible ink, and the following standard data set was coded for entry into the computer database: (1) item code, or catalog number, based on the site/unit/level provenience; (2) item type, whether artifact, faunal or floral sample, or other material; (3) raw material; (4) class (e.g., rim sherd, flake, adze, or specific taxon in the case of floral and faunal materials); (5) count (1 in the case of individual artifacts); (6) weight (in grams); and (7) a free-form comments field. These data fields were coded not only for all excavated artifacts, but for all floral and faunal materials (including those discarded in the field), and other kinds of samples.
The software and hardware utilized for this Mussau Project Database have changed several times over the 35-year life of the project, reflecting the rapid advances in computer technology from the mid-1980s to the present. A prototype of the database with over 14,000 entries was first developed at U. C. Berkeley using the UNIX platform on two networked SUN 3/50 workstations in the Oceanic Archaeology Laboratory; the database software used was Sybase SQL. In 1991, we transferred the database (which now exceeded 16,000 records) to a stand-alone PC, using Borlan’s PARADOX for DOS. This software proved much easier to use, while continuing to allow relational queries. Data could be transported to Borlan’s QUATTRO-PRO spreadsheet program, which provided a variety of statistical routines and graphical displays. For more complex statistical analyses, we used the SPSS and SAS software packages. Eventually, PARADOX ceased to be supported, and the database files were once again transferred, to Microsoft Access and Excel formats, in which they currently reside.
The Mussau Project database includes a total of 22,727 records representing 231,874 individual artifacts, faunal and floral remains, radiocarbon samples, and other materials. In addition to the main Mussau database, several specialized databases were developed, including those for ceramics, fishbones, and obsidian. More recently, the entire corpus of diagnostic Lapita pottery from sites ECA, ECB, and EHB has been recorded digitally on the Lapita Pottery Online Database (LPOD) maintained at the Institute of History and Philology, Academia Sinica, Taiwan (http://lapita.rchss.sinica.edu.tw/web/). Additionally, datasets associated with this book have been migrated into non-proprietary formats and made available through interactive pages on this website and deposited in the UCLA Library repository for long-term preservation and access (available through the DOI in the recommended citation for each dataset).
Reuse
Kirch, Patrick V., 2021. Mussau Artifact Catalog, supplementary materials online version for Talepakemalai: Lapita and its Transformations in the Mussau Islands of Near Oceania. Version 1. Cotsen Institute of Archaeology Press. https://doi.org/10.25346/S6/8ULQBJ